Dimensionality Reduction and Near Neighbor Search
Dimensionality Reduction
Johnson-Lindenstrauss Lemma: Consider any set of \(n\) data points \(\mathbf{x}_1, \ldots, \mathbf{x}_n \in \mathbb{R}^d\). There exists a linear map \(\mathbf{\Pi}: \mathbb{R}^d \rightarrow \mathbb{R}^k\) for \(k = O\left(\frac{\log n}{\epsilon^2}\right)\) such that for all \(i,j\), \[\begin{align} (1-\epsilon) \|\mathbf{x}_i - \mathbf{x}_j\|_2 \leq \|\mathbf{\Pi} \mathbf{x}_i - \mathbf{\Pi} \mathbf{x}_j\|_2 \leq (1+\epsilon) \|\mathbf{x}_i - \mathbf{x}_j\|_2. \end{align}\]
The reason the result is called a lemma is because Johnson and Lindenstrauss used it as a stepping stone to proving a different result. However, the lemma is immensely useful in its own right and has become a fundamental tool in machine learning.
We can visualize the dimensionality reduction in the figure below.

The Johnson-Lindenstrauss lemma is useful when \(d\) is large and \(k\) is small because we go from a representation \(\mathbf{x}_i \in \mathbb{R}^d\) to a representation \(\mathbf{\Pi} \mathbf{x}_i \in \mathbb{R}^k\).
Since \((1+\epsilon)^2 = 1 + O(\epsilon)\) and \((1-\epsilon)^2 = 1 - O(\epsilon)\) for small \(\epsilon\), we can write an equivalent formulation of the Johnson-Lindenstrauss lemma statement for the squared \(\ell_2\)-norm:
\[\begin{align} (1-\epsilon) \|\mathbf{x}_i - \mathbf{x}_j\|_2^2 \leq \|\mathbf{\Pi} \mathbf{x}_i - \mathbf{\Pi} \mathbf{x}_j\|_2^2 \leq (1+\epsilon) \|\mathbf{x}_i - \mathbf{x}_j\|_2^2. \end{align}\]
Notice that the Johnson-Lindenstrauss lemma is only helpful for us if we can efficiently compute the linear map \(\mathbf{\Pi}\). Fortunately, we can construct a linear map \(\mathbf{\Pi}\) that is easy to compute. One possible construction of \(\mathbf{\Pi}\) is a random Gaussian matrix where each entry \(\mathbf{\Pi}_{i,j}\) is drawn from \(\mathcal{N}(0,1)\) and rescaled by \(\frac1{\sqrt{k}}\) to preserve the norm of the vector.
The map \(\mathbf{\Pi}\) is oblivious to the data set. This is different from other techniques like PCA, and machine learning in general, that depend on the data set.
There are many other possible choices that work for the random projection: We can use random binary variables, sparse random matrices, and pseudorandom matrices. Each construction has its own advantages and disadvantages.

The figure above visualizes the random projection. Intuitively, the close points will remain close after the projection and the far points will remain far.
We will prove the Johnson-Lindenstrauss lemma in two steps. The intermediate step to proving the Johnson-Lindenstrauss lemma is the distributional Johnson-Lindenstrauss lemma.
Distributional Johnson-Lindenstrauss Lemma: Let \(\mathbf{\Pi} \in \mathbb{R}^{k \times d}\) be chosen so that each entry is drawn from the standard normal \(\mathcal{N}(0,1)\) and rescaled by \(\frac1{\sqrt{k}}\). If we choose \(k = O \left( \frac{\log(1/\delta)}{\epsilon^2} \right)\), then for any fixed \(\mathbf{x} \in \mathbb{R}^d\), with probability \(1-\delta\), \[\begin{align} (1-\epsilon) \|\mathbf{x}\|_2^2 \leq \|\mathbf{\Pi} \mathbf{x}\|_2^2 \leq (1+\epsilon) \|\mathbf{x}\|_2^2. \end{align}\]
We can use the distributional JL lemma to prove the JL lemma. Let \(\mathbf{x} = \mathbf{x}_i - \mathbf{x}_j\) for some \(i,j\). Then \[\begin{align} (1-\epsilon) \|\mathbf{x}_i - \mathbf{x}_j \|_2^2 \leq \|\mathbf{\Pi} \mathbf{x}_i - \mathbf{\Pi} \mathbf{x}_j \|_2^2 \leq (1+\epsilon) \|\mathbf{x}_i - \mathbf{x}_j \|_2^2. \end{align}\] This only works for a single pair of points but there are roughly \(n^2\) pairs of points that we care about. So setting \(\delta = \frac1{10 n^2}\) and applying the union bound gives the JL lemma with \[ k = O\left(\frac{\log (1/\delta)}{\epsilon^2}\right) = O\left(\frac{\log n} {\epsilon^2}\right). \]
Proving the Distributional JL Lemma
We have now reduced proving the JL lemma to proving the distributional JL lemma. That is, we want to argue that \[\begin{align*} (1-\epsilon) \|\mathbf{x}\|_2^2 \leq \| \mathbf{\Pi} \mathbf{x} \|_2^2 \leq (1+\epsilon) \|\mathbf{x}\|_2^2. \end{align*}\] with probability \(1-\delta\).
We’ll start by showing that \(\mathbb{E}[ \| \mathbf{\Pi} \mathbf{x} \|_2^2] = \|\mathbf{x}\|_2^2\). Let \(\frac1{\sqrt{k}} \mathbf{\pi}_i\) be the \(i\)th row of \(\mathbf{\Pi}\). By the way we built \(\mathbf{\Pi}\), we have that each entry in \(\mathbf{\pi}_i\) is drawn from a standard normal distribution \(\mathcal{N}(0,1)\). We can then write
\[\begin{align*} \mathbb{E}[ \| \mathbf{\Pi} \mathbf{x} \|_2^2 ] = \sum_{i=1}^k \frac1{k} \mathbb{E}[ \langle \mathbf{\pi}_i, \mathbf{x}\rangle^2 ] = \frac1{k} \sum_{i=1}^k \mathbb{E}\left[ \sum_{j=1}^d \left( \pi_{i}[j] \mathbf{x}_j \right)^2 \right] \end{align*}\] where \(\pi_{i}[j]\) is the \(j\)th entry of \(\mathbf{\pi}_i\) and is drawn from the standard normal distribution.
What type of random variable is this sum? We will use the following useful fact about Gaussians.
Fact (Stability of Gaussian Random Variables): Consider Gaussian random variables \(X_1 \sim \mathcal{N}(\mu_1, \sigma_1^2)\) and \(X_2 \sim \mathcal{N}(\mu_2, \sigma_2^2)\). Then \[X_1 + X_2 \sim \mathcal{N}(\mu_1 + \mu_2, \sigma_1^2 + \sigma_2^2).\]
The fact is intuitive but the proofs are involved.
We can apply this fact to our sum above. In particular, let \[\begin{align*} Z_i = \sum_{j=1}^d \pi_{i,j} \mathbf{x}_j. \end{align*}\] We will briefly argue that \(\pi_{i}[j] \cdot \mathbf{x}_j \sim \mathcal{N}(0, \mathbf{x}_j)\). If we assume that \(\pi_{i}[j] \cdot \mathbf{x}_j\) is still a Gaussian random variable then we know the expectation is \(0\) by linearity of expectation and the variance is \(\mathbf{x}_j^2\) since \(\textrm{Var}(c X) = c^2 \textrm{Var}(X)\) for any random variable \(X\) and constant \(c\). We will use this observation and apply the stability of Gaussian random variables to see that \[\begin{align*} Z_i \sim \mathcal{N}(0, \|\mathbf{x}\|_2^2). \end{align*}\] Then we can write \[\begin{align*} \mathbb{E}\left[ \mathbf{\Pi} \mathbf{x} \|_2^2 \right] = \frac1{k} \sum_{i=1}^k \mathbb{E}[Z_i^2] = \frac1{k} \sum_{i=1}^k \| \mathbf{x} \|_2^2 = \| \mathbf{x} \|_2^2. \end{align*}\] Here, we observed that \(\textrm{Var}(Z_i) = \mathbb{E}[Z_i^2] - \mathbb{E}[Z_i]^2 = \mathbb{E}[Z_i^2] = \|\mathbf{x}\|_2^2\) since \(\mathbb{E}[Z_i] = 0\).
Now that we know the expectation of \(\| \mathbf{\Pi} \mathbf{x} \|_2^2\), we will apply a concentration inquality to show that the random variable \(\| \mathbf{\Pi} \mathbf{x} \|_2^2\). We will use a specialized concentration inequality for chi-squared random variables with \(k\) degrees of freedom which are simply sums of \(k\) squared Gaussian random variables.
Concentration of Chi-squared Random Variables: Let \(Z\) be a chi-squared random variable with \(k\) degrees of freedom. Then \[\begin{align*} \Pr \left( |Z - \mathbb{E}[Z] | \geq \epsilon \mathbb{E}[Z] \right) \leq 2 e^{-\epsilon^2 k / 8}. \end{align*}\]
In our case, \[\begin{align*} Z = \mathbf{\Pi x} = \frac1{k} \sum_{i=1}^k \mathbb{E}[\langle \pi_i,\mathbf{x} \rangle ] = \frac1{k} \sum_{i=1}^k Z_i^2. \end{align*}\]
Applying the concentration inequality to \(Z\), we have \[\begin{align*} \Pr(|\mathbf{\Pi x} - \| \mathbf{x}\|_2^2 | \geq \epsilon \| \mathbf{x}\|_2^2) = \Pr(|Z - \mathbb{E}[Z] | \geq \epsilon \mathbb{E}[Z]) \leq 2 e^{-\epsilon^2 k / 8} = \delta. \end{align*}\]
Solving for \(k\), we have \[\begin{align*} \delta = 2 e^{-\epsilon^2 k / 8} \Leftrightarrow \log \frac2{\delta} = \epsilon^2 k / 8 \Leftrightarrow k = \frac{8}{\epsilon^2} \log \frac2{\delta}. \end{align*}\]
We have now shown the distributonal JL lemma. But we may find our result surprising because we previously saw how high-dimensional geometry differs wildly from low-dimensional geometry.
In order to reconcile these two results, let’s imagine the following hard case of \(n\) mutually orthogonal unit vectors in \(\mathbb{R}^d\). Let \(\mathbf{x}_1, \ldots, \mathbf{x}_n \in \mathbb{R}^d\) be mutually orthogonal vectors so that \[\begin{align*} \| \mathbf{x}_i - \mathbf{x}_j \|_2 = 2. \end{align*}\] The JL lemma tells us we can compress these vectors to \(k = O(\log n / \epsilon^2)\) dimensions while preserving the distances up to a factor of \(1 \pm \epsilon\). From our result for nearly orthogonal vectors, we know that there are \(2^{O(\epsilon^2 \log n /\epsilon^2)} \geq n\) vectors that are \(\epsilon\) orthogonal in \(O(\log n / \epsilon^2)\) dimensions. So the JL lemma pushes us just to the limit of the dimension we can compress to while still approximately preserving inner products.
An alternate view is that, without additional structure, we expect that learning in \(d\) dimensions requires \(n=2^d\) data points. If really had a data set that large, then the JL lemma would be vacuous since \(\log n = d\).
The JL lemma tells us how we can preserve \(\ell_2\)-norm distances between points. Let’s see how we can preserve similarity between points.
Similarity Estimation
Let’s consider the following problem: How do services like Shazam match a song clip against a library of more than 11 million songs in a fraction of a second? To make the problem more challenging, the song clips we match generally have additional noise like background sound in a car.
We know how Shazam does this because they published a white paper on their method. The key idea is to use a spectrogram to represent the song clip. A spectrogram is a 2D matrix where the rows correspond to frequencies and the columns correspond to time. We then convert the spectrogram to a fingerprint by taking the peaks in the spectrogram represented as a high-dimensional binary vector.
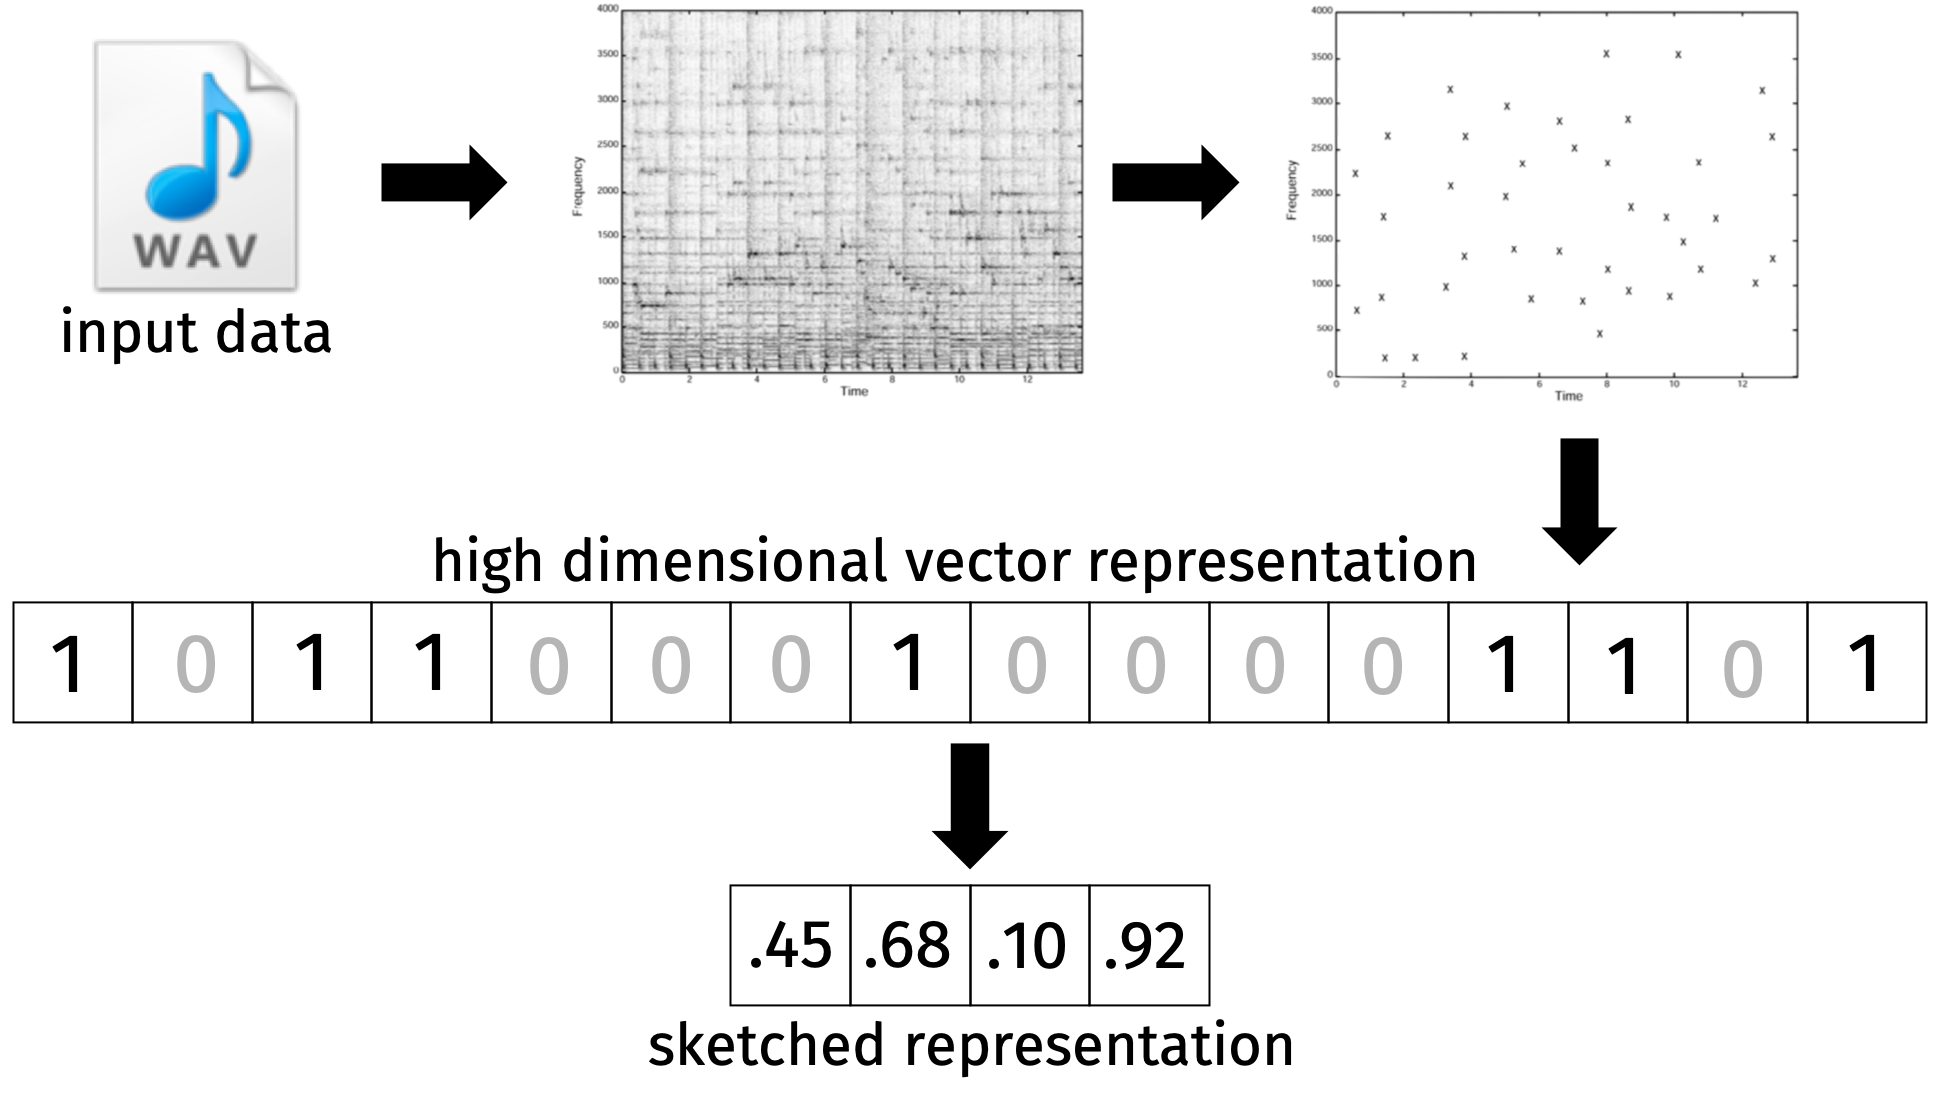
The process is a little more challenging because song clips may be slightly off set from the song clips in our database. In order to make the method work, they use anchor points to align the song clips. But, for our purposes, we are primarily interested in how we can compress the high-dimensional binary vector.
Once we have a fingerprint from a song clip, we want to search our database for similar songs. Formally, given a binary vector \(q \in \{0,1\}^d\) representing our song clip in \(d\) dimensions, we want to find a nearby fingerprint \(\mathbf{y} \in \{0,1\}^d\) in our database. The first challenge is that our database is possibly huge with \(O(nd)\) bits where \(n\) is the number of song clips. The second challenge is that it is expensive to compute the distance between \(\mathbf{y}\) and \(\mathbf{x}\) wit run time \(O(d)\).
In light of these challenges, our goal is to design a more compact sketch for comparing \(\mathbf{x}\) and \(\mathbf{y}\). We ideally want to use \(k \ll d\) space and time complexity. We will compute a compression \(C(\mathbf{x})\) and \(C(\mathbf{y})\) of \(\mathbf{x}\) and \(\mathbf{y}\), respectively. As in the JL compressions, we want \(C(\mathbf{x})\) and \(C(\mathbf{y})\) to be close when \(\mathbf{x}\) and \(\mathbf{y}\) are similar and far otherwise.
We will use the notion of Jaccard similarity to measure the similarity between \(\mathbf{x}\) and \(\mathbf{y}\).
Jaccard Similary: The Jaccard similarity between \(\mathbf{x}\) and \(\mathbf{y}\) is \[\begin{align*} J(\mathbf{x}, \mathbf{y}) = \frac{|\mathbf{x} \cap \mathbf{y}|}{|\mathbf{x} \cup \mathbf{y}|} = \frac{\textrm{# non-zero entries in common}}{\textrm{# non-zero entries in total}}. \end{align*}\]
Jaccard similarity can be applied to any data which has a natural binary representation:
We can use the “bag-of-words” model to represent a document as a binary vector where each entry is 1 if the word is in the document and 0 otherwise. Then the Jaccard similarity is the fraction of words in common between the two documents.
We can extract features from earthquake data for early detection. The approach is described in this paper.
We can compare cached web pages to determine if they are similar and avoid downloading the same content multiple times.
MinHash Algorithm
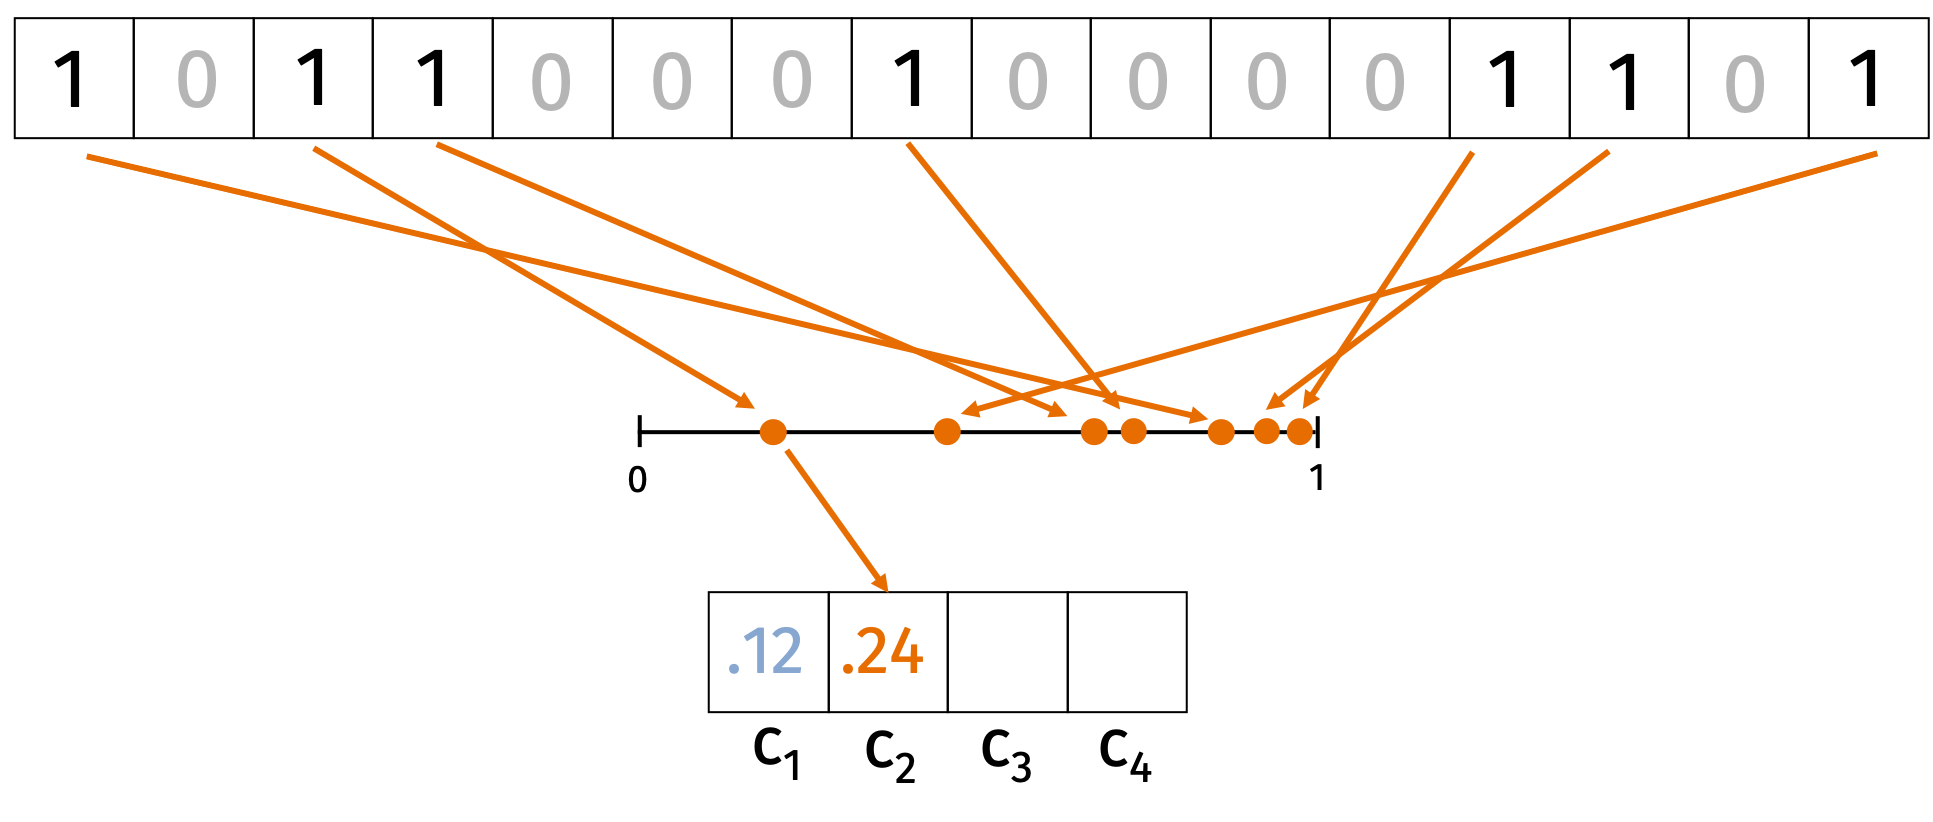
We’ll use the MinHash algorithm to build the compression function \(c:\{0,1\}^d \rightarrow \mathbb{R}^k\).
Consider an input \(\mathbf{x} \in \{0,1\}^d\). We start by choosing \(k\) random hash functions \(h_i: \{0, \ldots, d\} \rightarrow [0,1]\) for \(i \in [k]\). For each hash function \(h_i\) we’ll compute \[\begin{align*} c_i = \min_{j \in \{1, \ldots, d\}: \mathbf{x}_j = 1} h_i(j). \end{align*}\] In words, we hash each index where \(\mathbf{x}\) is non-zero and hash it to a random value in \([0,1]\). Then we take the minimum value of the hash function over all the non-zero indices. The compression is \(C(\mathbf{x}) = (c_1, \ldots, c_k)\). We can see this process represented in the figure below.
We’ll argue that for all \(i\), \[\begin{align*} \Pr \left( c_i(\mathbf{x}) = c_i(\mathbf{y}) \right) = J(\mathbf{x}, \mathbf{y}) = \frac{|\mathbf{x} \cap \mathbf{y}|}{|\mathbf{x} \cup \mathbf{y}|}. \end{align*}\]
Every non-zero index in \(\mathbf{x} \cup \mathbf{y}\) is equally likely to produce the lowest hash value. We have \(c_i(\mathbf{x}) = c_j(\mathbf{x})\) if and only if the index hashed to the lowest value is 1 in both \(\mathbf{x}\) and \(\mathbf{y}\). Since there are \(|\mathbf{x} \cap \mathbf{y}|\) such indices, the probability that \(c_i(\mathbf{x}) = c_j(\mathbf{x})\) is the Jaccard similarity.
Inspired by this observation, the MinHash algorithm returns an estimate for the Jaccard similarity between \(\mathbf{x}\) and \(\mathbf{y}\): \[\begin{align*} \tilde{J}(\mathbf{x}, \mathbf{y}) = \frac1{k} \sum_{i=1}^k \mathbb{1}[c_i(\mathbf{x}) = c_i(\mathbf{y})]. \end{align*}\] By linearity of expectation, we have \[\begin{align*} \mathbb{E}[\tilde{J}(\mathbf{x}, \mathbf{y})] = \frac1{k} \sum_{i=1}^k \Pr( c_i(\mathbf{x}) = c_i(\mathbf{y})) = J(\mathbf{x}, \mathbf{y}). \end{align*}\] We can reduce the variance of the estimator by increasig the number of hash functions \(k\). The variance of the estimator is \[\begin{align*} \textrm{Var}( \tilde{J}(\mathbf{x}, \mathbf{y}) ) &= \frac1{k^2} \sum_{i=1}^k \textrm{Var}( \mathbb{1}[c_i(\mathbf{x}) = c_i(\mathbf{y})] ) \\ &= \frac1{k^2} \sum_{i=1}^k J(\mathbf{x}, \mathbf{y}) - J(\mathbf{x}, \mathbf{y})^2 \leq \frac1{k} J(\mathbf{x}, \mathbf{y}) \leq \frac1{k}. \end{align*}\]
How big should we choose \(k\) so that the the estimate is with an additive error \(\epsilon\) of its expectation with probability \(1-\delta\)?
Chebyshev’s inequality tells us that \[\begin{align*} \Pr\left( | J(\mathbf{x}, \mathbf{y}) - \tilde{J}(\mathbf{x}, \mathbf{y}) | \geq \alpha \frac{1}{\sqrt{k}}\right) \leq \frac1{\alpha^2} = \delta \end{align*}\]
The additive error is \(\epsilon= \alpha \frac{1}{\sqrt{k}}\). Since \(\alpha = \sqrt{\delta}\), we have \(k = \frac1{\epsilon^2 \delta}\).
We have shown that as long as \(k=O(\frac1{\epsilon^2 \delta})\), then with probability \(1-\delta\), \[\begin{align*} J(\mathbf{x}, \mathbf{y}) - \epsilon \leq \tilde{J} (\mathbf{x}, \mathbf{y}) \leq J(\mathbf{x}, \mathbf{y}) + \epsilon. \end{align*}\] Notice that we only need \(O(k)\) time to compute the estimate which is independent of the original fingerprint dimension \(d\).
We can improve the result to have a \(\log(1/\delta)\) dependence using a Chernoff bound or the biased coin bound we showed in the third lecture.
Biased Coin Bound: Let the probability that a coin lands heads be \(b\). Choose \(k \geq 3\log(2/\delta)\). If we flip a biased coin \(k\) times, let \(S\) be the number of heads. Notice that \(\mu = bk\). Then \[ \Pr(| S - b k | \geq \epsilon k) \leq \delta. \]
Think of the indicator random variables \(\mathbb{1}[c_i(\mathbf{x}) = c_i(\mathbf{y})]\) as coin flips. The probability the coin lands “heads” is \(J(\mathbf{x}, \mathbf{y})\). Then we can apply the biased coin bound after dividing by \(k\). With probability \(1-\delta\), the number of “heads” is within \(\epsilon\) of \(J(\mathbf{x}, \mathbf{y})\) if we set \(k=O(\frac{\log(1/\delta)}{\epsilon^2})\).
Near Neighbor Search
Our prior goal was to preserve distances between points. But the real reason we care about preserving distances is to find nearby points. In this section, we’ll focus on the near neighbor search problem. We want to find vectors in a database \(\mathbf{y}_1, \ldots, \mathbf{y}_n \in \mathbb{R}^d\) that are close to an input query vector \(\mathbf{x} \in \mathbb{R}^d\).
We showed before how to improve the runtime of linear scans from \(O(nd)\) to \(O(nk)\) and the space complexity from \(O(nd)\) to \(O(nk)\). This can be helpful but we want to go even further to an algorithm which finds nearby vectors with runtime sublinear in \(n\).
To see convince yourself it is possible to find nearest neighbors in sublinear time, consider the problem in one dimension. We know how to solve this problem in \(\log_2 n\) time using binary search. We can generalize this approach to higher dimensions with data structures like k-d trees. Unfortunately, the runtime is roughly \(O(d \min(n, 2^d))\) which is sublinear only for \(d=o(\log n)\).
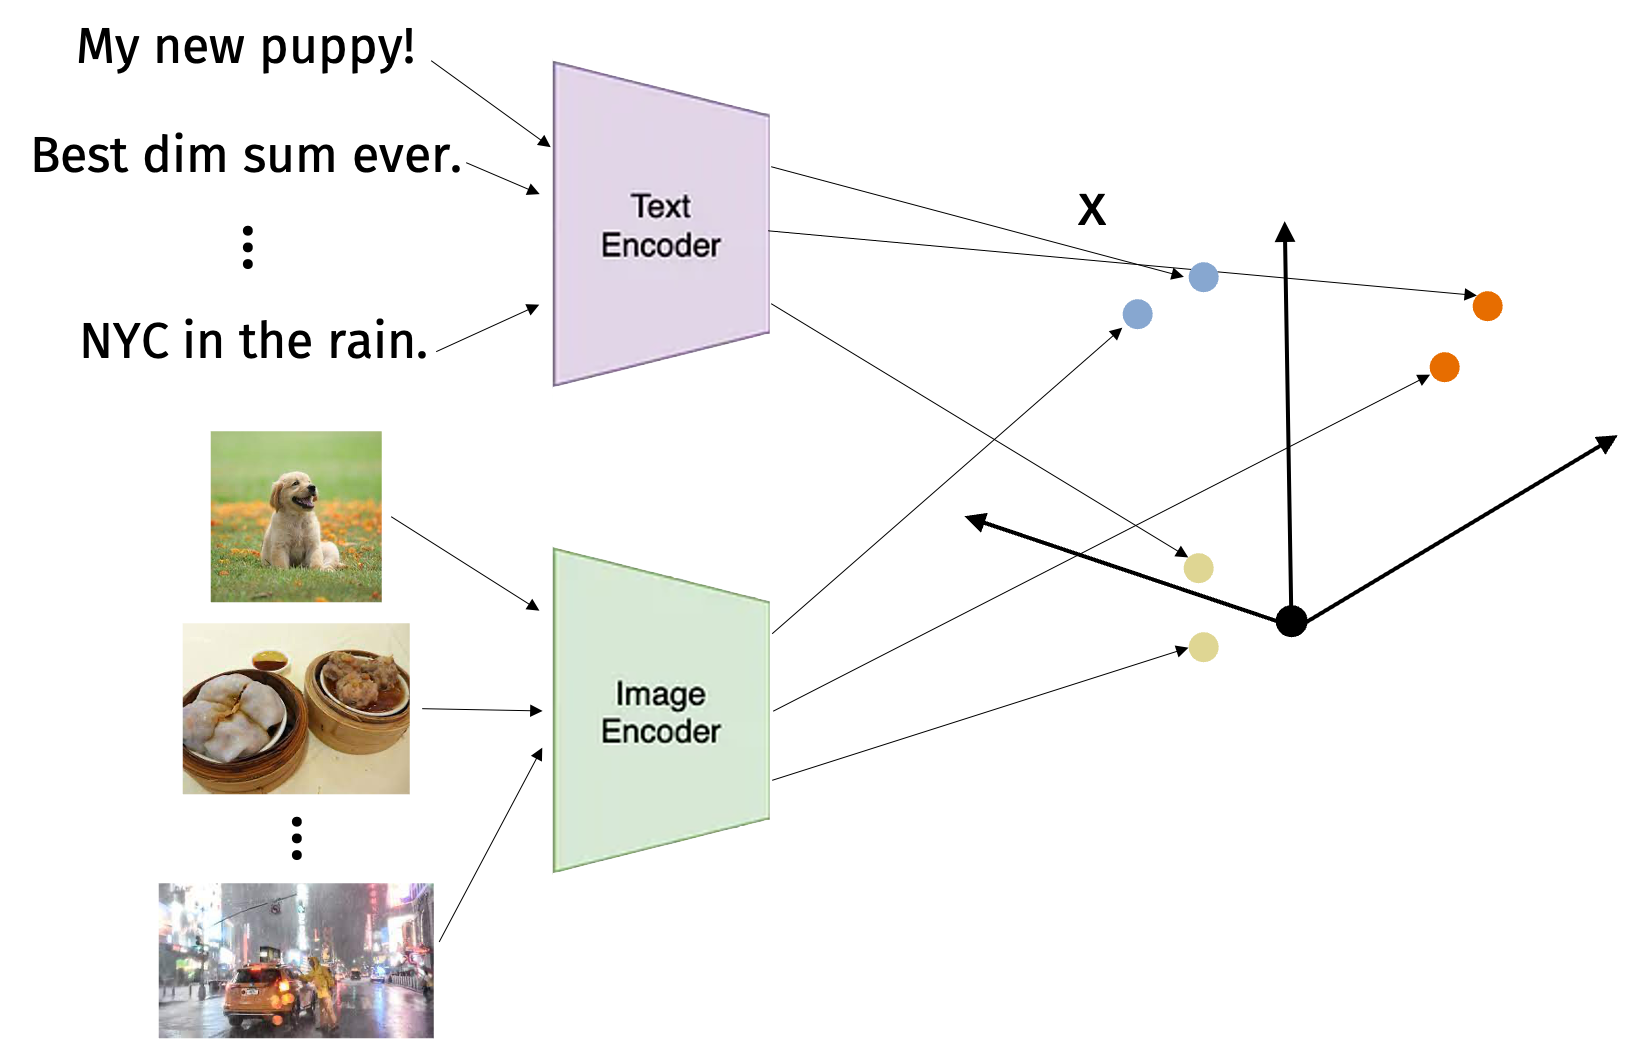
High-dimensional vector search is exploding as a research area because of machine-elarning multi-model embeddings for images, text, and more. For example, models like CLIP allow us to embed images and text into a common space. Then we can search for images that are similar to a text query or vice versa.
There are many approaches to nearest neighbor search including spectral hashing and vector quantization. Today, we’ll focus on locality sensitive hashing (LSH). The key insight of LSH is to trade worse space complexity for better time complexity. So we’ll use \(O(n)\) space or more but we’ll get sublinear time complexity.
Locality Sensitive Hashing
Let \(h: \mathbb{R}^d \rightarrow \{1, \ldots, m\}\) be a random hash function. Consider a similarity function \(s\) such as the Jaccard similarity. We call \(h\) locally sensitive if \(\Pr(h(\mathbf{x}) = h(\mathbf{y}))\) is high when \(\mathbf{x}\) and \(\mathbf{y}\) are similar and low when \(\mathbf{x}\) and \(\mathbf{y}\) are dissimilar.
We will now take a first stab at designing the LSH scheme. Let \(c: \{0,1\}^d \rightarrow [0,1]\) be a single instantiation of MinHash. Let \(g: [0,1] \rightarrow \{1, \ldots, m\}\) be a uniform random hash function. Then we’ll define the locally sensitive hash function \(h(\mathbf{x}) = g(c(\mathbf{x}))\).
Observe that \(h(\mathbf{x}) = h(\mathbf{y})\) when \(c(\mathbf{x}) = c(\mathbf{y})\) or when \(\mathbf{x}\) and \(\mathbf{y}\) happen to randomly be mapped to the same output. In mathematical notation, we have \[\begin{align*} \Pr(h(\mathbf{x}) = h(\mathbf{y})) &= \Pr(c(\mathbf{x}) = c(\mathbf{y})) + \left( 1- \Pr(c(\mathbf{x}) = c(\mathbf{y})) \right) \frac1{m} \\ &\leq J(\mathbf{x}, \mathbf{y}) + \frac1{m}. \end{align*}\]
The basic approach for near neighbor search in a database has two steps. In the preprocessing step, we select a random LSH hash function \(h: \{0,1\}^d \rightarrow \{1,\ldots, m\}\). We create a table with \(m=O(n)\) slots. For each vector \(\mathbf{y}_i\) with \(i \in [n]\), we compute \(h(\mathbf{y}_i)\) and store \(\mathbf{y}_i\) in the corresponding slot in the table.
In the query step, we want to find near neighbors of \(\mathbf{x}\). We compute \(h(\mathbf{x})\) and look in the corresponding slot of the table. We then scan through all the vectors in the slot and compute the distance to \(\mathbf{x}\). The time required is now the time to compute the distance between the query vector and each vector in the slot.
There are two main considerations that we want to analyze. The first is the false negative rate: What’s the probability we do not find a vector that is close to \(\mathbf{x}\)? The second is the false positive rate: What’s the probability that a vector in the slot is not close to \(\mathbf{x}\)?
A higher false negative rate means we may miss a vector that is close to \(\mathbf{x}\). A higher false positive rate means we increase the runtime of the query step because we have to scan through more vectors in the slot. Note that the meaning of “close” and “not close” is application dependent. For example, we may want to find anything with Jaccard similarity at least \(.4\) but we may not want to compare against anything with similarity less than \(.2\).
We can reduce the false negative rate by using multiple hash functions. In the preprocessing step, we now select \(t\) independent LSH hash functions \(h_1, \ldots, h_t\). We create tables \(T_1, \ldots, T_t\) each with \(m\) slots. For every vector \(i \in [n]\) and every table \(j\) , we compute \(h_1(\mathbf{y}_i), \ldots, h_t(\mathbf{y}_i)\) and store \(\mathbf{y}_i\) in the corresponding slots in \(T_1, \ldots, T_t\). In the query step we compute \(h_1(\mathbf{x}), \ldots, h_t(\mathbf{x})\) and look in each one of the corresponding slots in \(T_1, \ldots, T_t\).
We can now analyze the probability that we find a nearby vector \(\mathbf{y}\) that has Jaccard similarity at least \(.4\). The probability that we find \(\mathbf{y}\) is \[\begin{align*} 1 - \Pr(h_1(\mathbf{x}) \neq h_1(\mathbf{y})) \cdots \Pr(h_t(\mathbf{x}) \neq h_t(\mathbf{y})) = 1-(1-J(\mathbf{x}, \mathbf{y}))^t. \end{align*}\] If the Jaccard similarity is \(.4\) and \(t=10\), then the probability that we find \(\mathbf{y}\) is \(1-(1-.4)^t \approx .99\). But now we have a new problem which is that we may find many false positives. If the Jaccard similarity is \(.2\) and \(t=10\), then the probability that we find \(\mathbf{y}\) is \(1-(1-.2)^t \approx .89\). Now that we reduced the false negative rate, we need to find a way to reduce the false positive rate.
We can reduce the false positive rate by modifying our LSH scheme one more time. Choose a positive integer \(r\). Let \(c_1, \ldots, c_r: \{0,1\}^d \rightarrow[0,1]\) be independent instantiations of MinHash. Let \(g:[0,1]^r \rightarrow \{1,\ldots,m\}\) be a uniform random hash function. Then define the LSH hash function is \(h(\mathbf{x}) = g(c_1(\mathbf{x}), \ldots, c_r(\mathbf{x}))\). We refer to \(r\) as the number of bands. Now the probability that \(\mathbf{x}\) and \(\mathbf{y}\) are in the same slot in a particular table is \[\begin{align*} \Pr(h(\mathbf{x}) = h(\mathbf{y})) = J(\mathbf{x}, \mathbf{y})^r + (1-J(\mathbf{x}, \mathbf{y})^r) \frac1{m} \end{align*}\]
The full LSH scheme now has two parameters \(r\) the number of bands and \(t\) the number of tables. Changing \(r\) and \(t\) changes the false positive and false negative rates. If we increase the number of tables \(t\), we decrease the false negative rate and increase the false positive rate. If we decrease the number of bands \(r\), we increase the false negative rate and decrease the false positive rate.
Intuitively, these parameters are in tension but we can find a sweet spot that works well for each application.
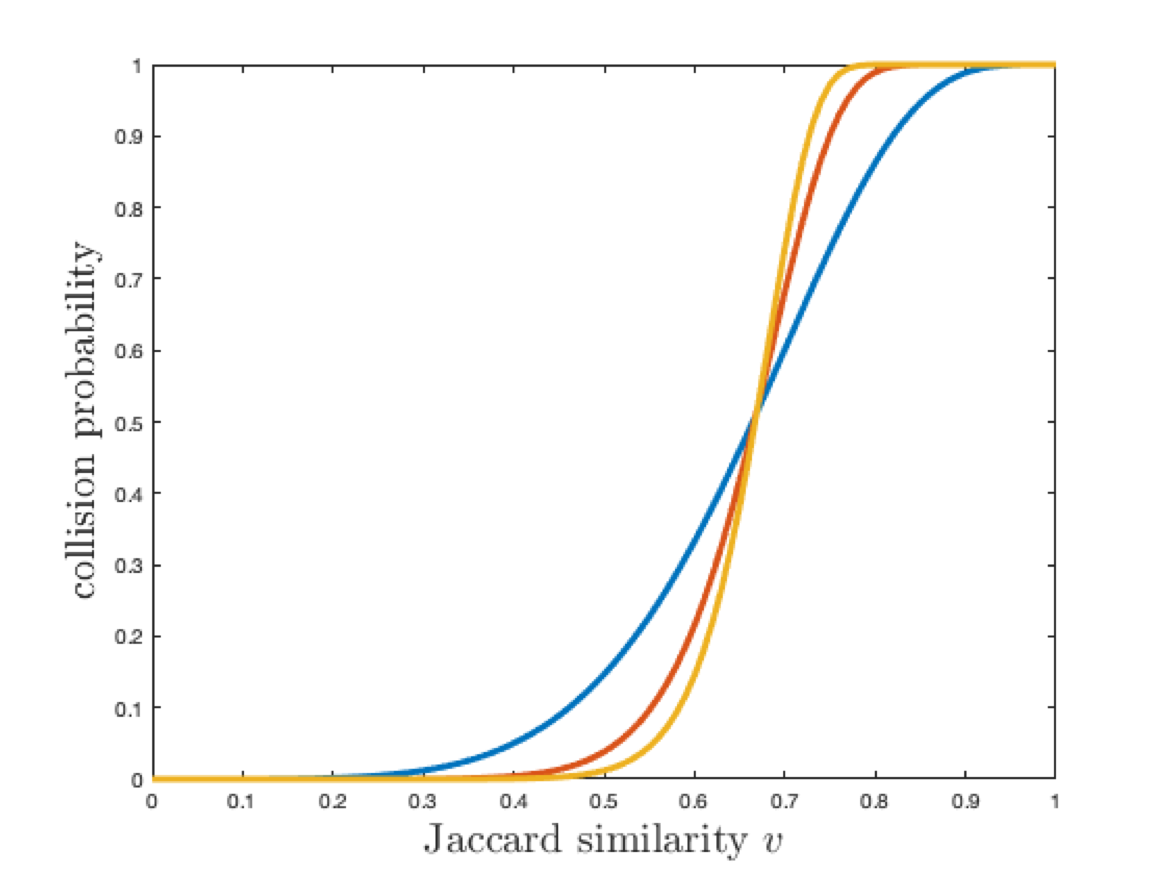
Increasing both \(r\) and \(t\) gives a steep curve which is better for search but worse for space complexity.
SimHash
We just showed how the MinHash algorithm gives a good LSH scheme for Jaccard similarity. There are also LSH schemes for other similarity functions. We’ll now show how to design a LSH scheme for cosine similarity.
Cosine similarity is a measure of similarity between two vectors \(\mathbf{x}\) and \(\mathbf{y}\). Formally, \[\begin{align*} \cos(\theta(\mathbf{x}, \mathbf{y})) = \frac{\langle \mathbf{x}, \mathbf{y} \rangle}{\|\mathbf{x}\|_2 \|\mathbf{y}\|_2}. \end{align*}\]
We can think of cosine similarity as a natural “inverse” for Euclidean distance. Suppose \(\mathbf{x}\) and \(\mathbf{y}\) are unit vectors. Then we have \[\begin{align*} \| \mathbf{x} - \mathbf{y} \|_2^2 &= \langle \mathbf{x} - \mathbf{y}, \mathbf{x} - \mathbf{y} \rangle \\ &= \| \mathbf{x} \|_2^2 + \| \mathbf{y} \|_2^2 - 2 \langle \mathbf{x}, \mathbf{y} \rangle = 2 - 2 \cos(\theta(\mathbf{x}, \mathbf{y})). \end{align*}\]
Let’s design a LSH scheme for cosine similarity with \(r\) bands. Let \(\mathbf{g}_1, \ldots, \mathbf{g}_r \in \mathbb{R}^d\) be random vectors with each entry drawn from the standard normal distribution \(\mathcal{N}(0,1)\). Let \(f: \{-1, 1\}^r \to \{1, \ldots, m\}\) be a uniform random hash function. Then we define the LSH hash function \(h: \mathbb{R}^d \to \{1, \ldots, m\}\) as \[\begin{align*} h(\mathbf{x}) = f([\textrm{sign}(\langle \mathbf{g}_1, \mathbf{x} \rangle), \ldots,\textrm{sign}(\langle \mathbf{g}_r, \mathbf{x} \rangle) ]). \end{align*}\]
Let \(\theta = \theta(\mathbf{x}, \mathbf{y})\). We will show that \[\begin{align*} \Pr( h(\mathbf{x}) = h(\mathbf{y}) ) = 1 - \frac{\theta}{\pi} + \frac{1}{m}. \end{align*}\]
As an intermediate result, we will show that \[\begin{align*} \Pr( \langle \mathbf{g}, \mathbf{x} \rangle = \langle \mathbf{g}, \mathbf{y} \rangle ) = 1 - \frac{\theta}{\pi}. \end{align*}\]
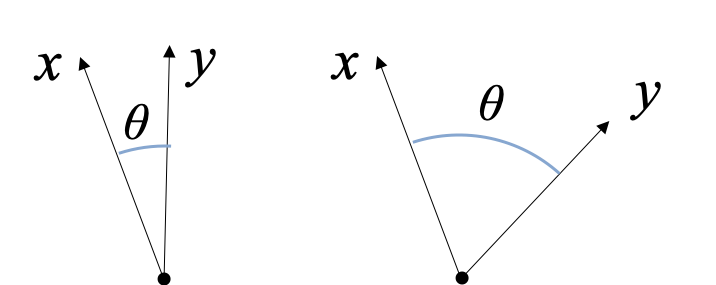
We will first show the result in one dimension. Consider the random vector \(\mathbf{g}\) and its hyperplane. Since it is drawn from the standard normal distribution, the direction of \(\mathbf{g}\) is uniformly distributed around the unit circle. Similarly, the hyperplane is also uniformly distributed around the unit circle. The sign of the inner product \(\langle \mathbf{g}, \mathbf{x} \rangle\) specifies which side of the hyperplane \(\mathbf{x}\) is on. Intuitively, the probability that \(\mathbf{x}\) and \(\mathbf{y}\) are on the same side of the hyperplane is proportional to their angle. We can make this formal with the following visualization.
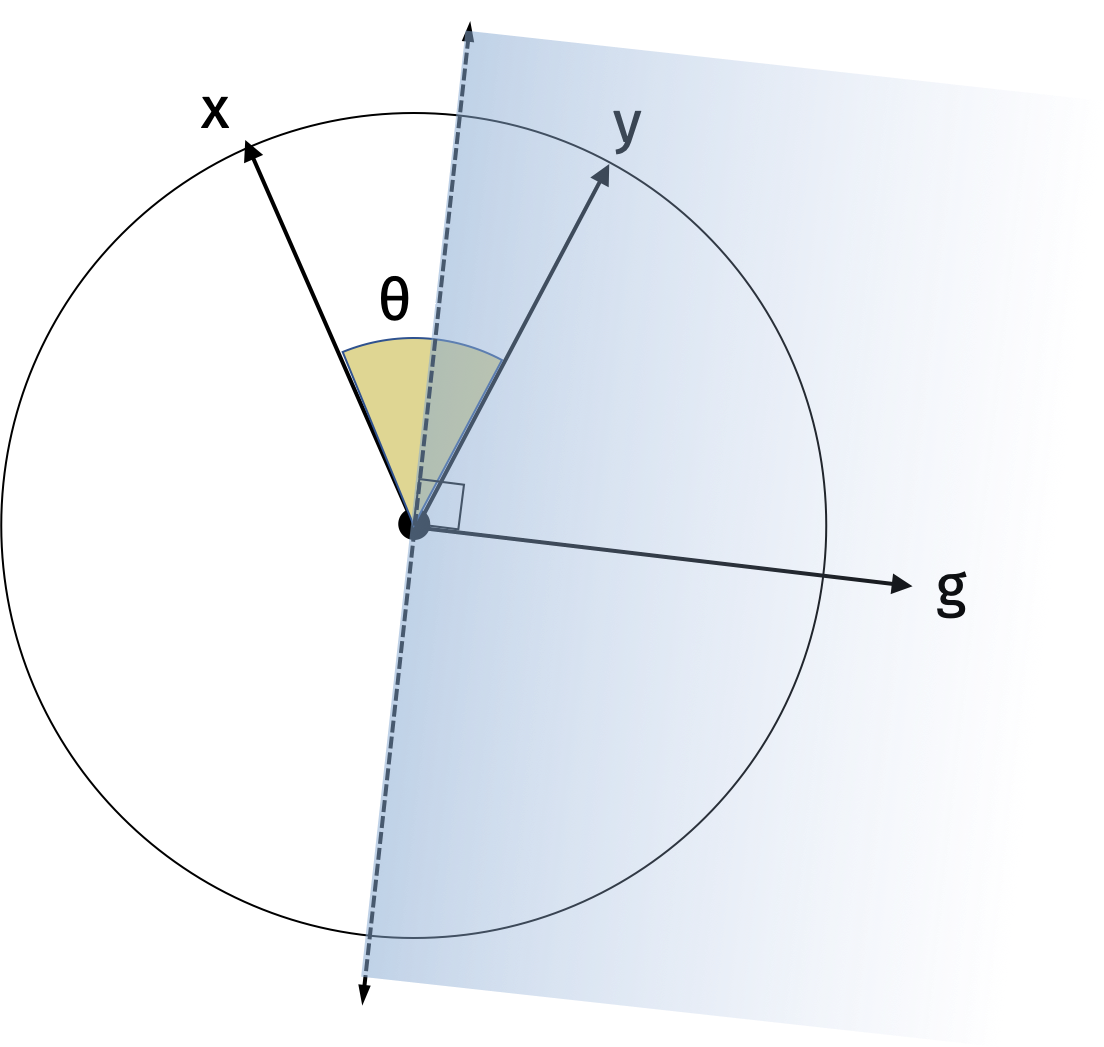
The probability that they lie on different sides of the hyperplane is the probability that the random hyperplane falls between \(\mathbf{x}\) and \(\mathbf{y}\) which is \(\frac{2\theta}{2\pi}\). Then the probability that they lie on the same side of the hyperplane is \(1-\frac{\theta}{\pi}\).
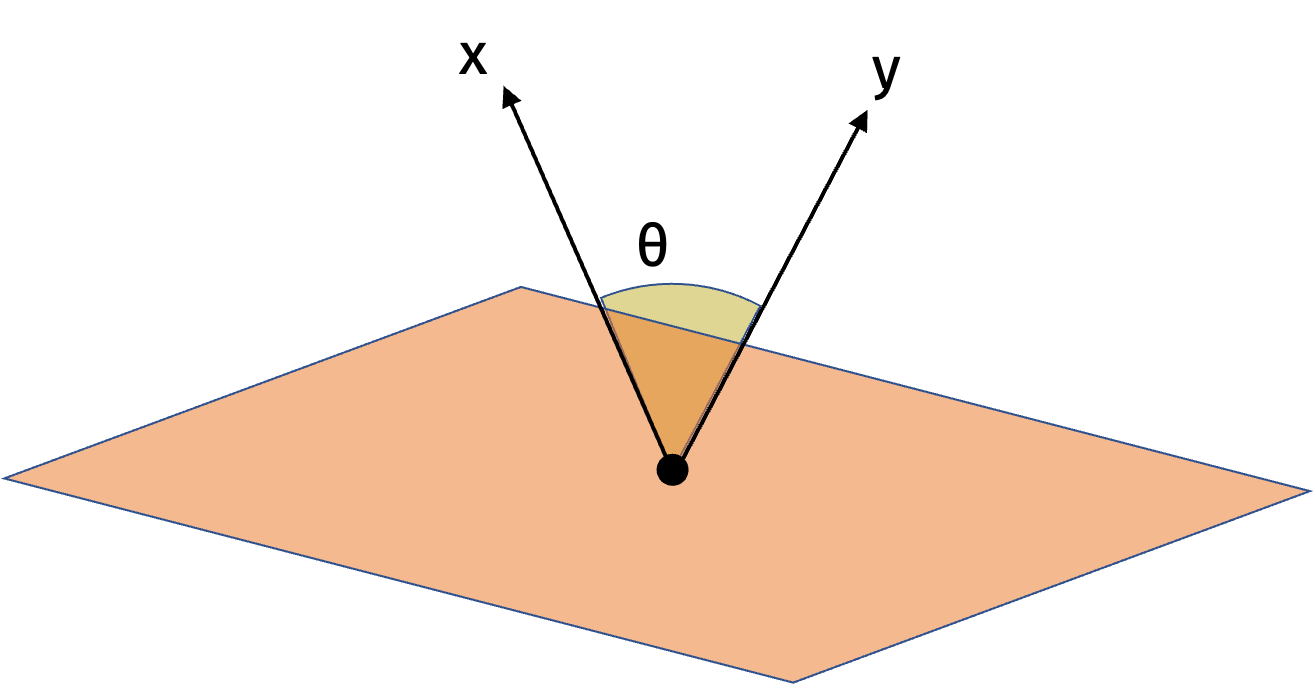
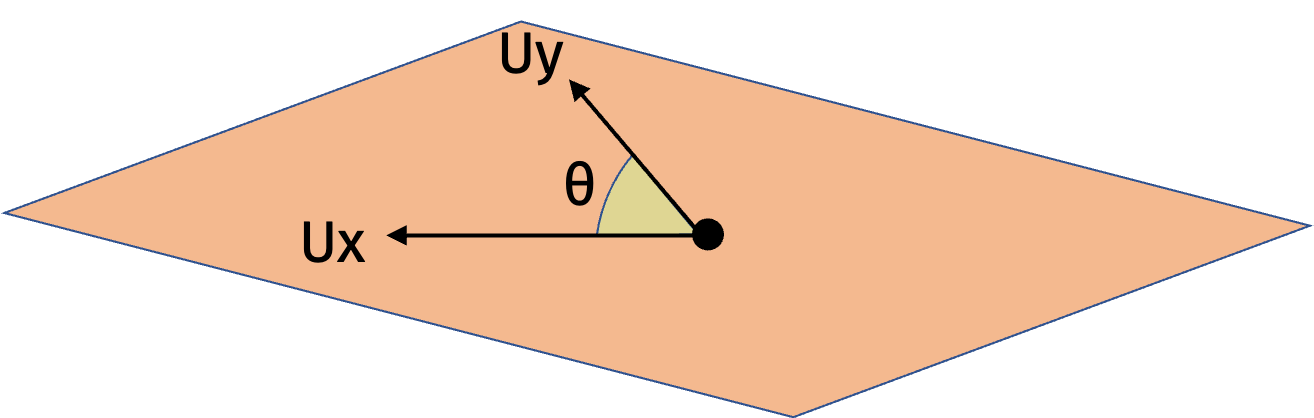
In higher dimensions, we can use the same intuition. There is always some rotation matrix \(\mathbf{U}\) such that \(\mathbf{Ux}\) and \(\mathbf{Uy}\) are spanned by the first two standard basis vectors and have the same cosine similarity as \(\mathbf{x}\) and \(\mathbf{y}\). Then we can apply the result in one dimension to \(\mathbf{Ux}\) and \(\mathbf{Uy}\).
We have shown how to design LSH schemes that perform well in expectation. But we are also interested in the worst case performance. Such guarantees can be proven and were actually a major driving force in the development of LSH schemes.
Theorem (Indyk and Motwani 1998): If there exists some vector \(\mathbf{y}\) with \(\|\mathbf{x} - \mathbf{y}\|_0 \leq R\), then we can return a vector \(\hat{\mathbf{y}}\) with \(\|\mathbf{x} - \hat{\mathbf{y}}\|_0 \leq C \cdot R\) in \(O(n^{1/C})\) time and \(O(n^{1+1/C})\) space.